Trading the Double Top Pattern

Today we will talk about yet another chart pattern that traders can use to glean profits; the DOUBLE TOP pattern. The double top is a bearish reversal pattern that signifies when prices have topped out and are ready for a reversal. The double top is made up of two successive peaks that are formed as follows:
a) a period of rising prices that hit a resistance before retreating back to a certain level that forms a short term support (the first peak).
b) a second period of rising prices that hit the same resistance or a price region that is very close to that resistance level before prices retreat to the same short term support area.
c) A line can be drawn to connect the two points that form the short term support to form a neckline. The neckline forms the critical element that guides the trader on the trade entry.
The double top strategy is therefore to trade a break of the neckline to the downside. Confirmation of the downside break of the neckline occurs when a candlestick closes below that trend line support (i.e. the neckline).
Entry Rules
Wait for the double top formation to be completed. It is very essential the full double top pattern forms and gets to the neckline. When there is confirmation of a break of this neckline support (by the candle in view closing below the neckline), the trader can place a short trade at the open of the next candle.
Alternatively, the trader can trace the neckline and then set a Sell Stop order about 15 pips below the neckline, waiting for the break of the neckline support to trigger the trade. Utmost care must be taken here so that a candle that merely crosses the neckline to the downside before retreating does not suck the trader into a trade without assured results.
Sometimes, a peculiar situation occurs where the price of the currency pair has a knee jerk reaction upwards, testing the support-turned-resistance. If the trader missed the initial trade, this is an opportunity to re-enter.
Exit Rules
The standard exit rule for the double top is to measure the distance in pips from the neckline to the peaks, and then set that distance as the profit target for the trade. If the price continues further south, the trader can set a trailing stop 15 pips beyond the profit target and follow the trade to its logical conclusion.
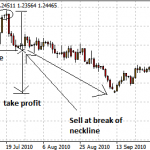
The chart below shows a double top along with its entry and exit rules.
On this chart, we can see the double top formation, and the neckline. Once the neckline has been broken, a short order is placed and we can see clearly that the price dropped to a level which corresponds to the same distance between the neckline and the peak of the price tops.
Traders have to be very careful to make sure that the double top forms completely before they take a position because there are many false double top formations that will not give the desired trade results. The example above shows a clear formation, and how the trader should approach setting of targets.


